A quick tour of SKOPIA Lens — Schedule View, Health Check, the Format Converter, the Lens Pro Resources tools, and SKOPIA Command. Upload a schedule and follow along. Switch tabs below.
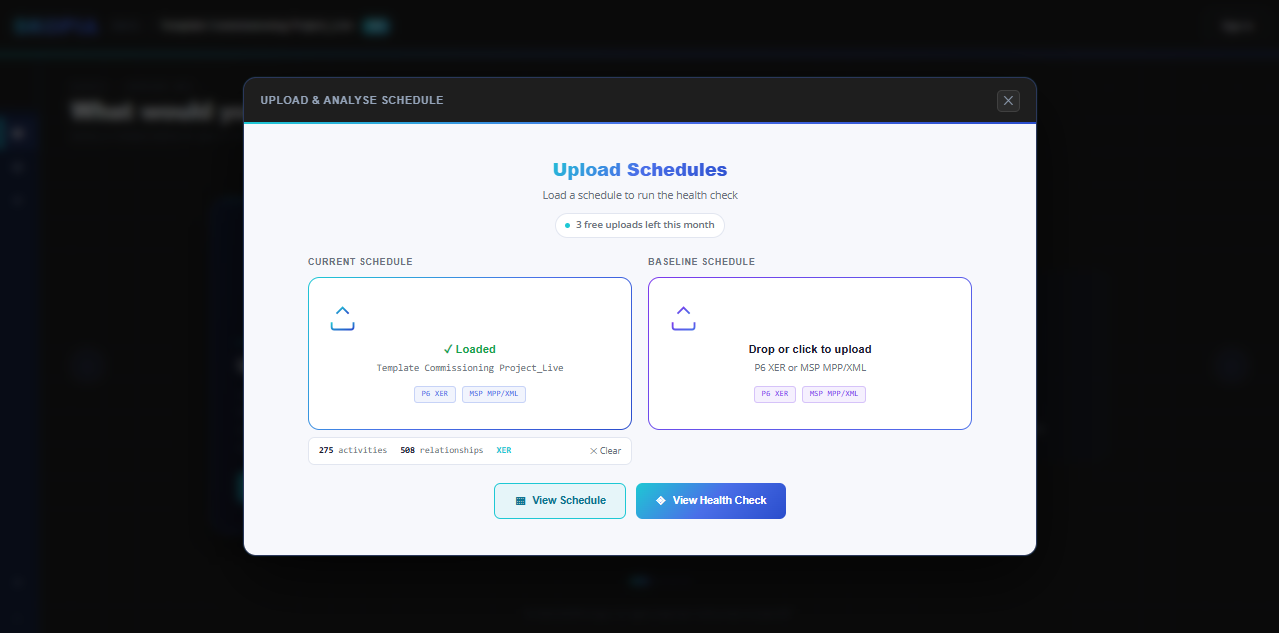
Drop in a P6 XER or MSP MPP/XML file and SKOPIA drops you straight into Schedule View — no import wizard, no setup. Add a baseline schedule alongside it if you want to compare.
Upload lives on the Hub, the app's landing view — click the Upload & Analyse tile.
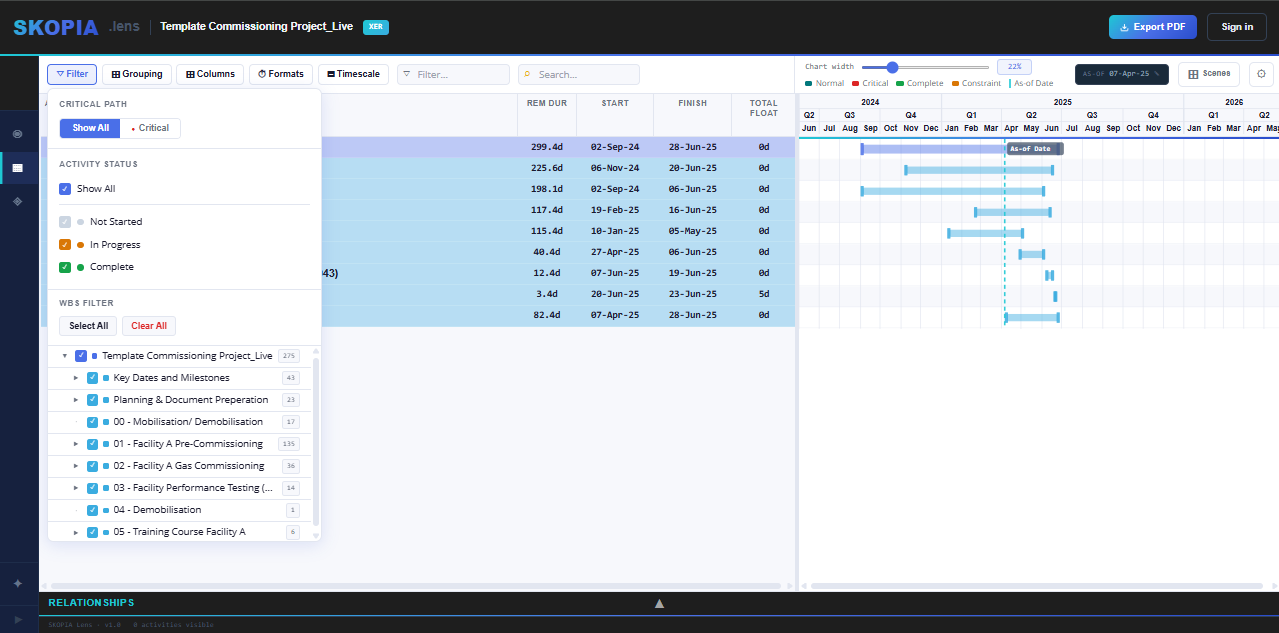
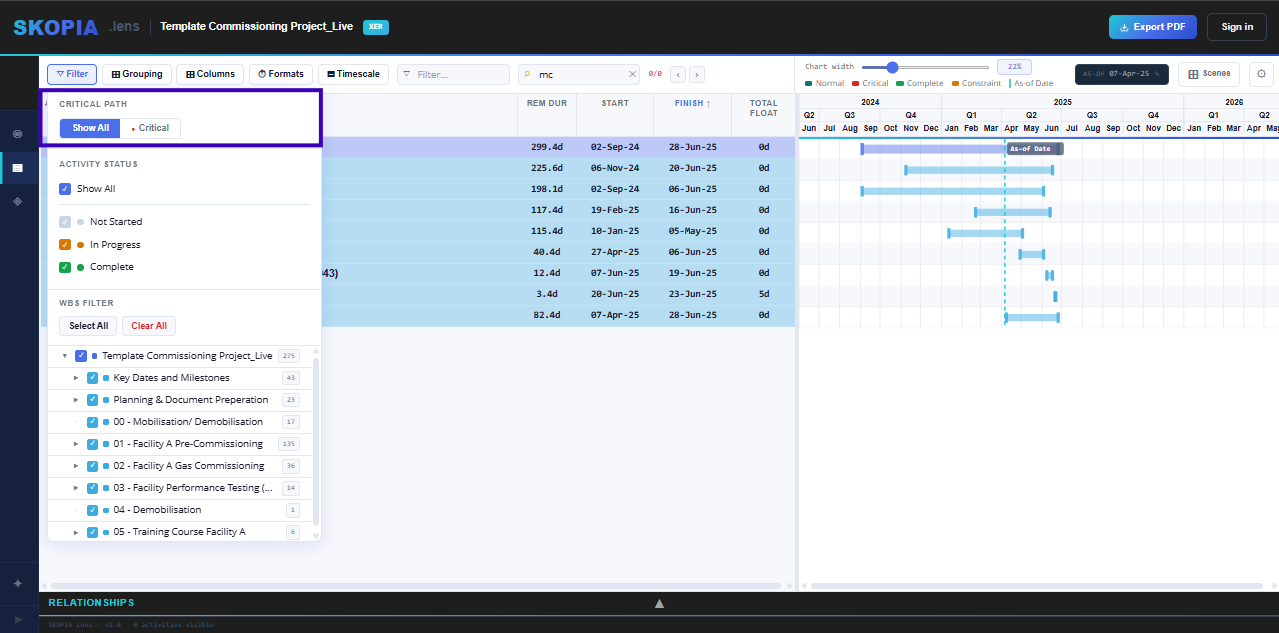
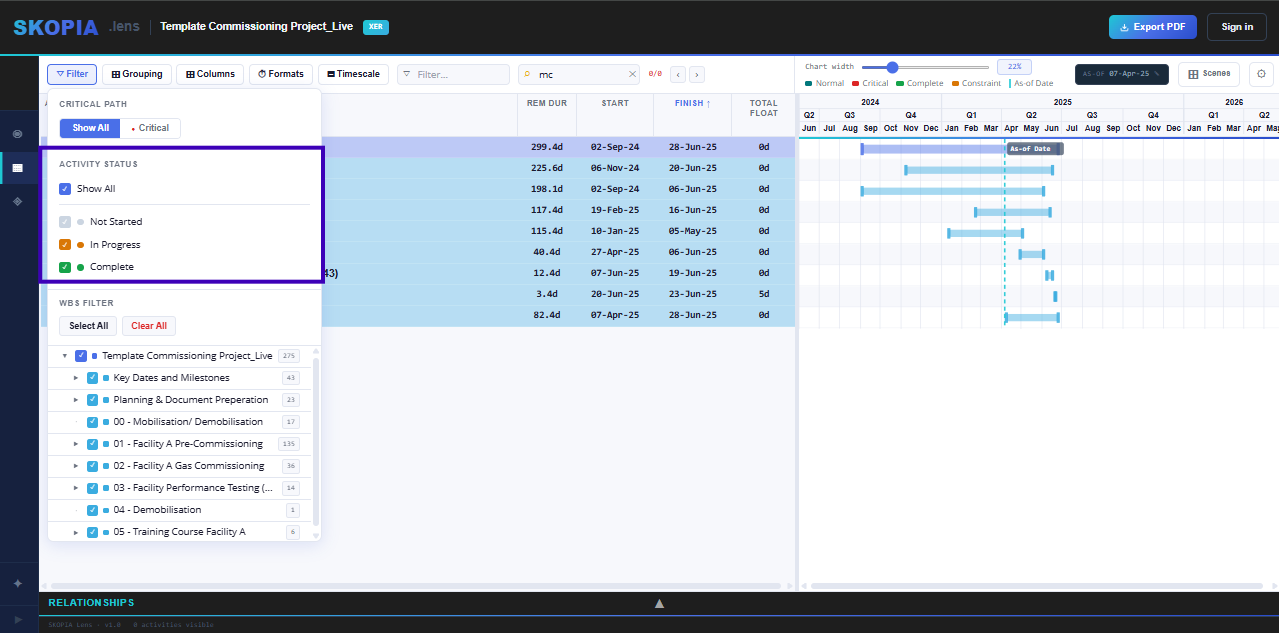
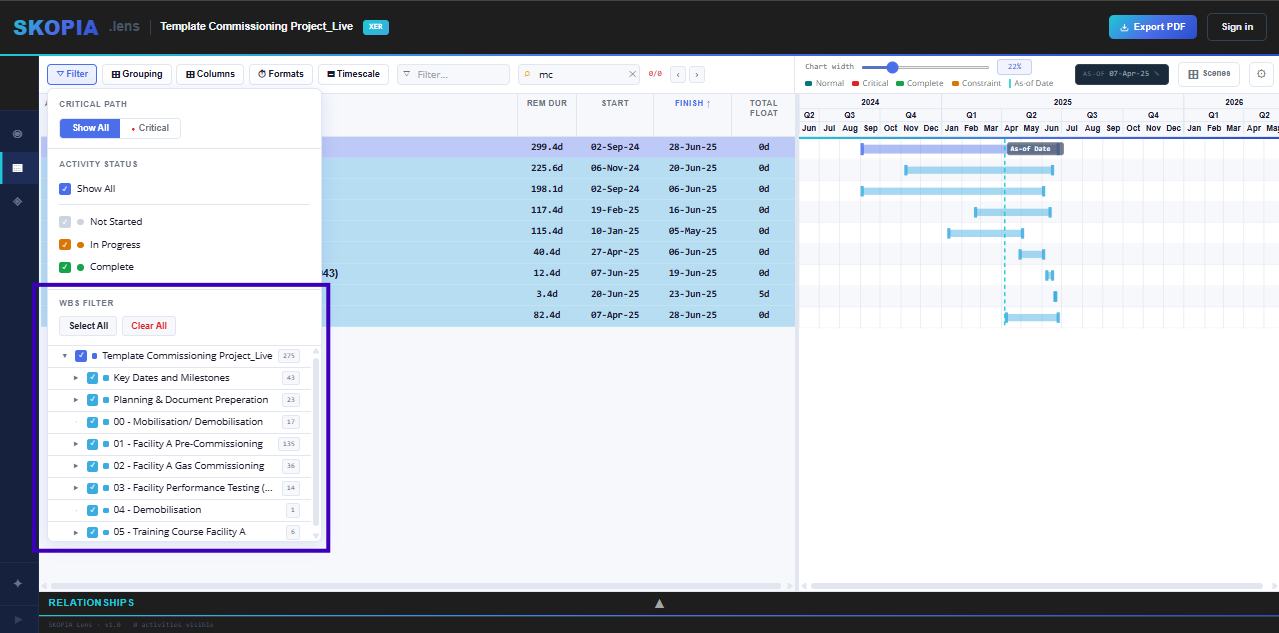
One button covers everything that narrows down what you're looking at. Click Filter in the toolbar and a single dropdown opens with six sections, in this order:
- Critical Path — Show All or Critical only.
- Activity Status — one dropdown: All, Not Started, In Progress, Complete, Not Complete, Started, or Not Started + Complete.
- Lookahead — 2, 4, 6 or 12 weeks from the data date, or your own number. Unfinished activities touching the window.
- Custom Filters — + New filter builds a P6-style user-defined filter from any column, codes and UDFs included, matching all or any of its rows. Saved filters switch on and off.
- Issue Filters — ready-made post-update checks with counts: actuals after the data date, 100% but not Complete, open ends, out-of-sequence progress, negative float and more.
- WBS Filter — tick any branch of the WBS tree to isolate it, with Select All / Clear All.
They all combine. A small dot appears on the Filter button whenever anything is narrowing your view, and your filters save with the Scene.
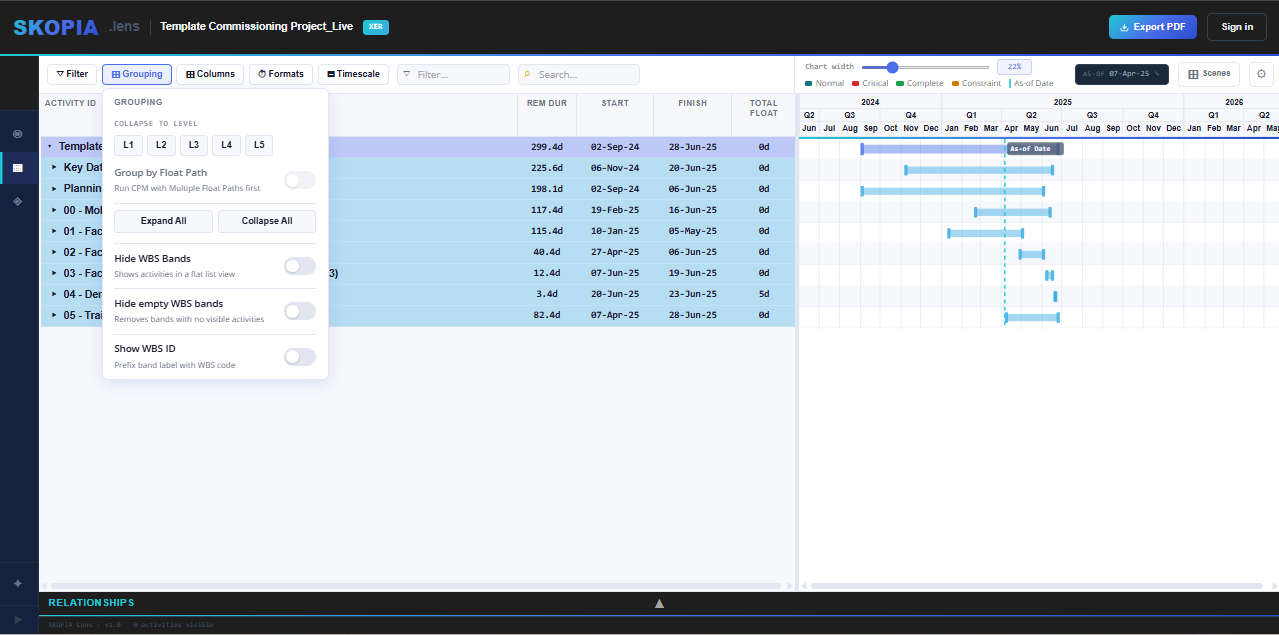
Group by WBS, P6's default, or by any column: + Add level up to five levels (an activity code, then Status, say). Dates group by week, month, quarter or year; numbers by an interval. WBS keeps its full hierarchy as level 1. Each level can carry its own band and text colour, and Back to WBS resets it. With WBS banding you also get:
- Collapse to Levels — jump straight to a WBS depth (L1–L5) instead of expanding manually.
- Expand All / Collapse All — open or close every band in one click.
- Hide WBS Bands — flatten the view to a plain activity list.
- Hide Empty WBS Bands — drop bands with no visible activities under the current filter.
- Show WBS ID — prefix each band label with its WBS code.
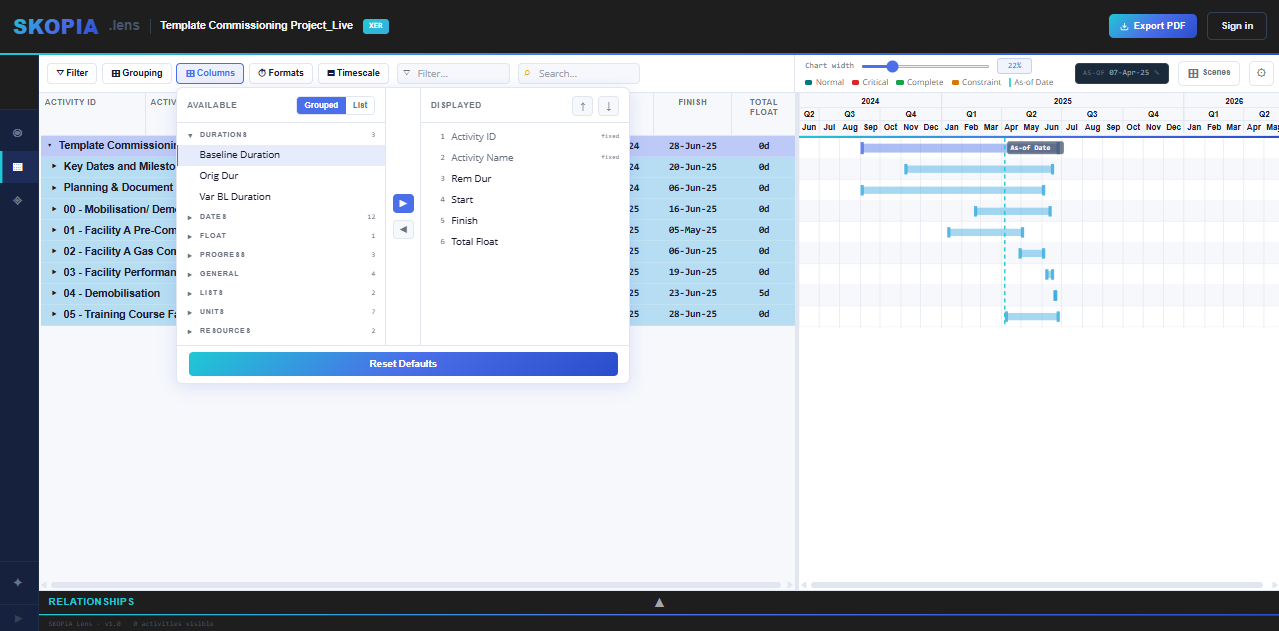
Click the columns icon for a two-pane column picker:
- Available (left) — every column not currently shown. Toggle Grouped (by category, with collapsible headers) or List (flat, A–Z).
- Displayed (right) — your visible columns, in on-screen order.
- ▶ / ◀ — move columns between the two panes. Multi-select with Ctrl/Cmd-click or Shift-click.
- ↑ / ↓ — reorder the Displayed list directly.
Activity ID and Activity Name are fixed — always shown, never removable.
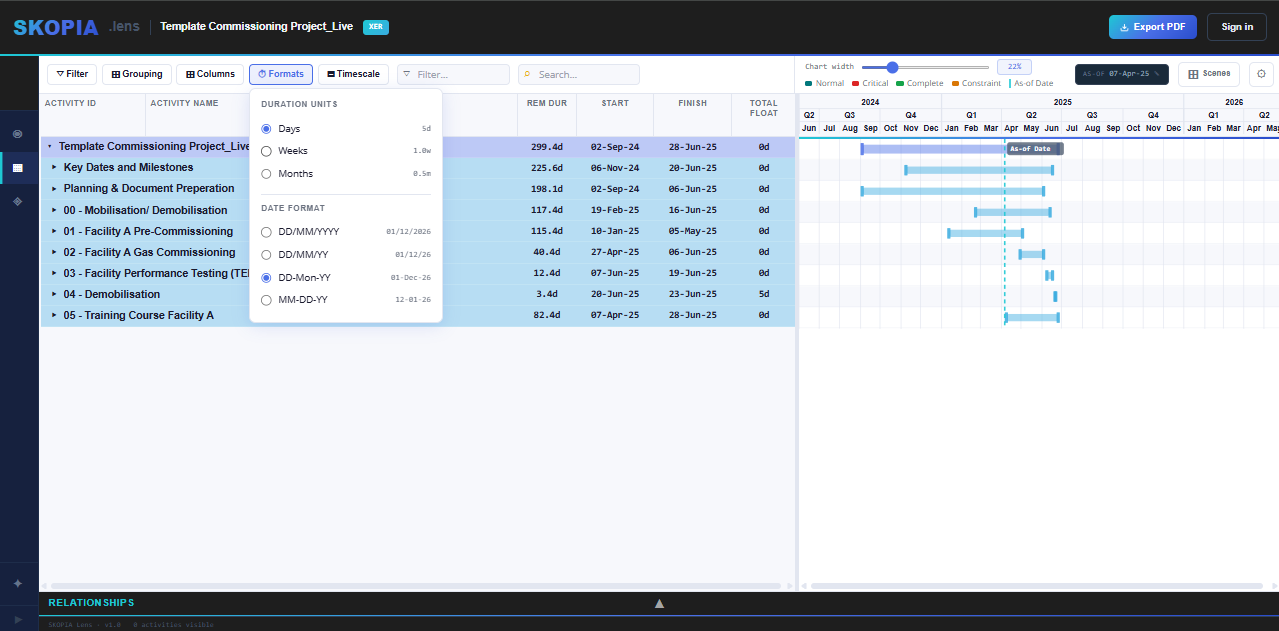
Toggle duration units and date formats to whatever you're used to — Days, Weeks, Months, or Years for duration; DD/MM/YYYY, DD-MMM-YY, or DD-Mon-YY for dates. Applies across the whole table instantly.
- Show Time in Dates — append the time component to every date in the table.
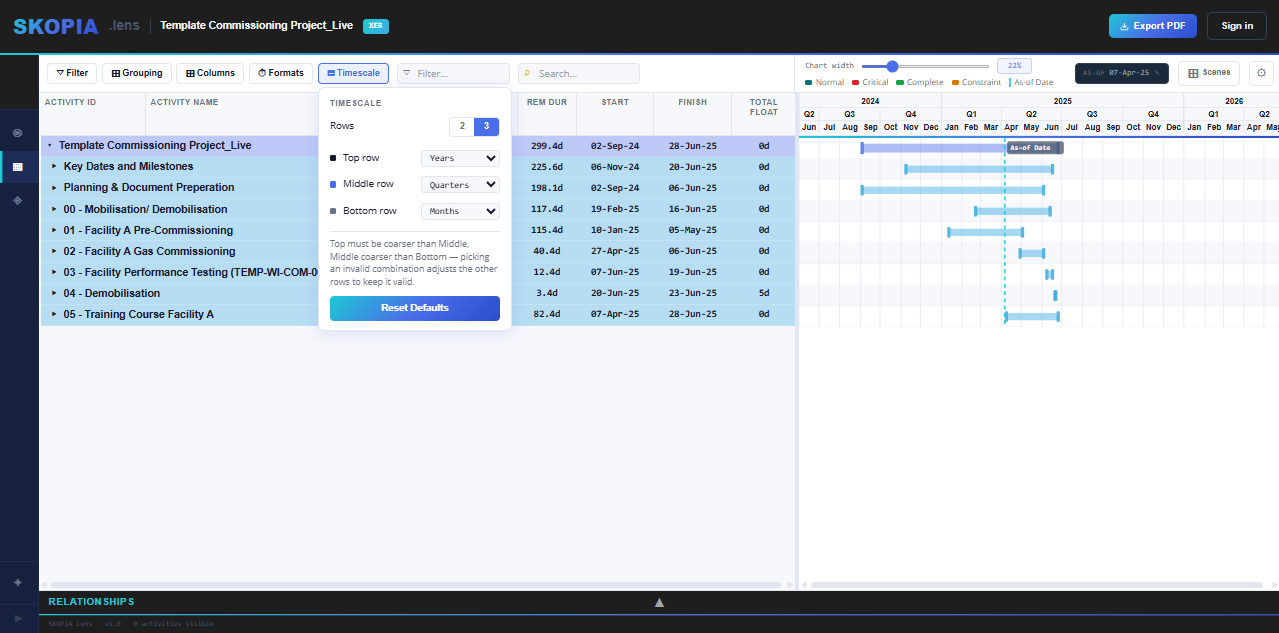
A timescale picker for the Gantt header. The default is 2 rows, Years / Quarters. Choose 2 or 3 header rows, then pick which unit — Years, Half Years, Quarters, Months, or Weeks — occupies the Top, Middle, and Bottom row. Top must be coarser than Middle, Middle coarser than Bottom; picking an invalid combination nudges the other rows to stay valid rather than blocking the change.
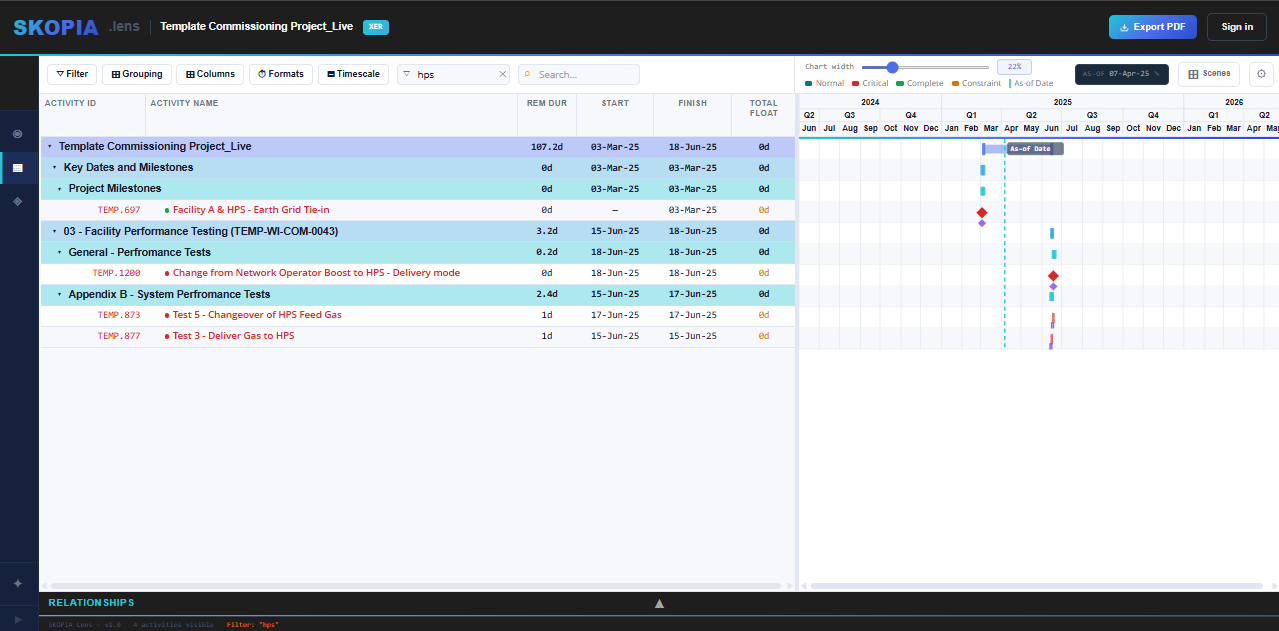
The text box in the toolbar (funnel icon) filters by typing — matches on Activity ID and Activity Name. Anything that doesn't match drops out of both the table and the Gantt, same as ticking off a WBS branch or a status. Clear the box to bring everything back.
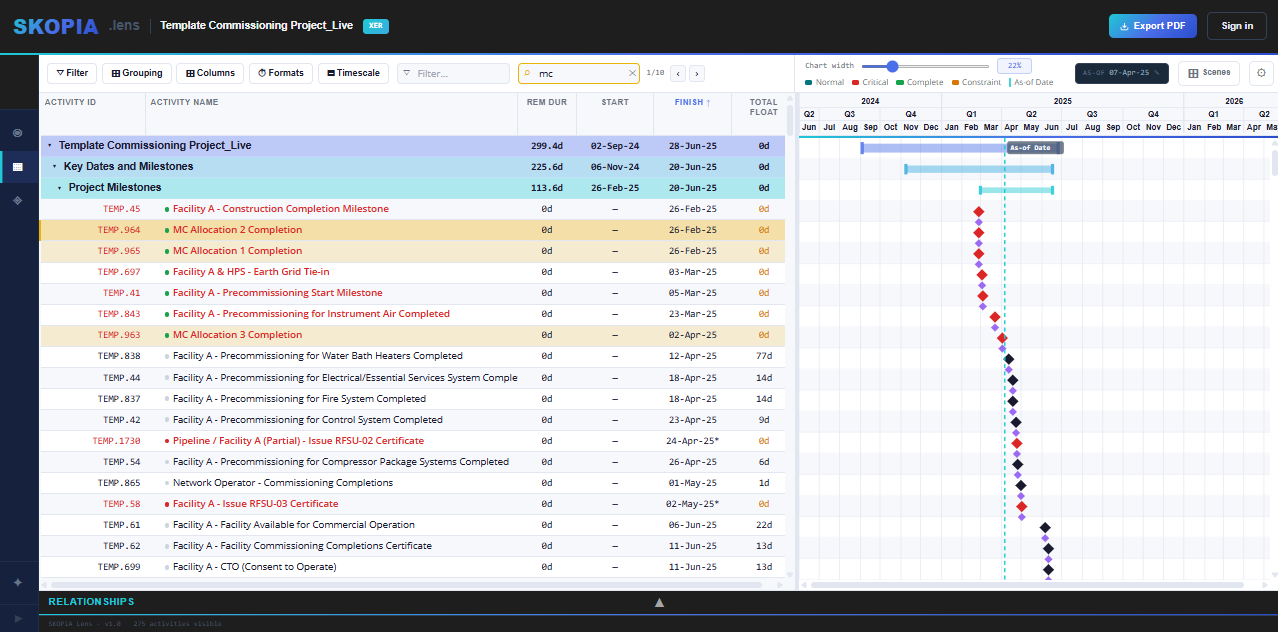
Search sits right after Filter, but works differently — it doesn't hide anything. Matches highlight in place (gold), and Next / Previous (Enter / Shift+Enter, or the ‹ › buttons) step through them, scrolling each one into view. A counter shows where you are — e.g. 3/12.
Because Search doesn't filter, a row can be both selected (yellow) and a search match (gold) at the same time — the two stay visually distinct.
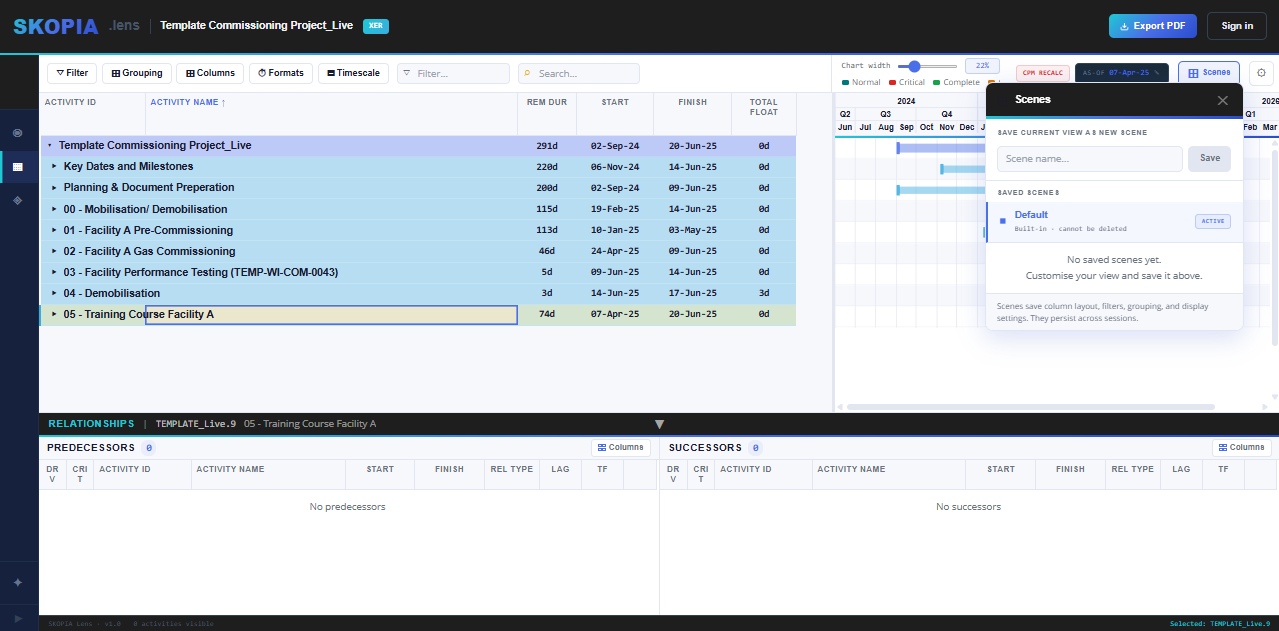
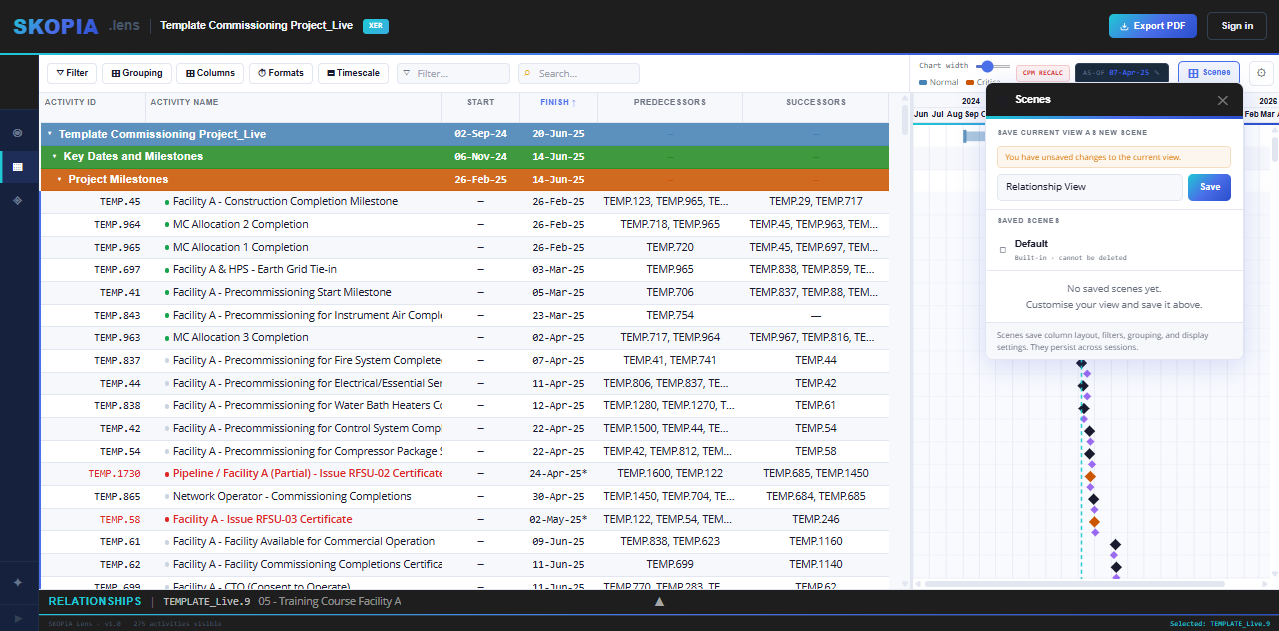
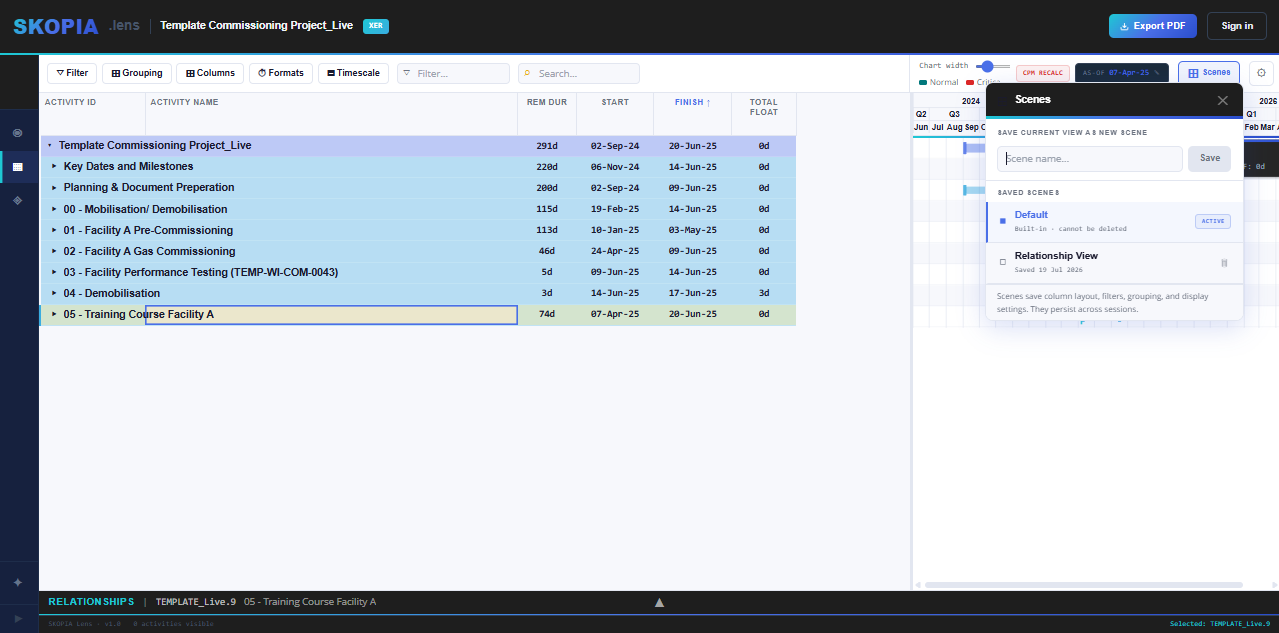
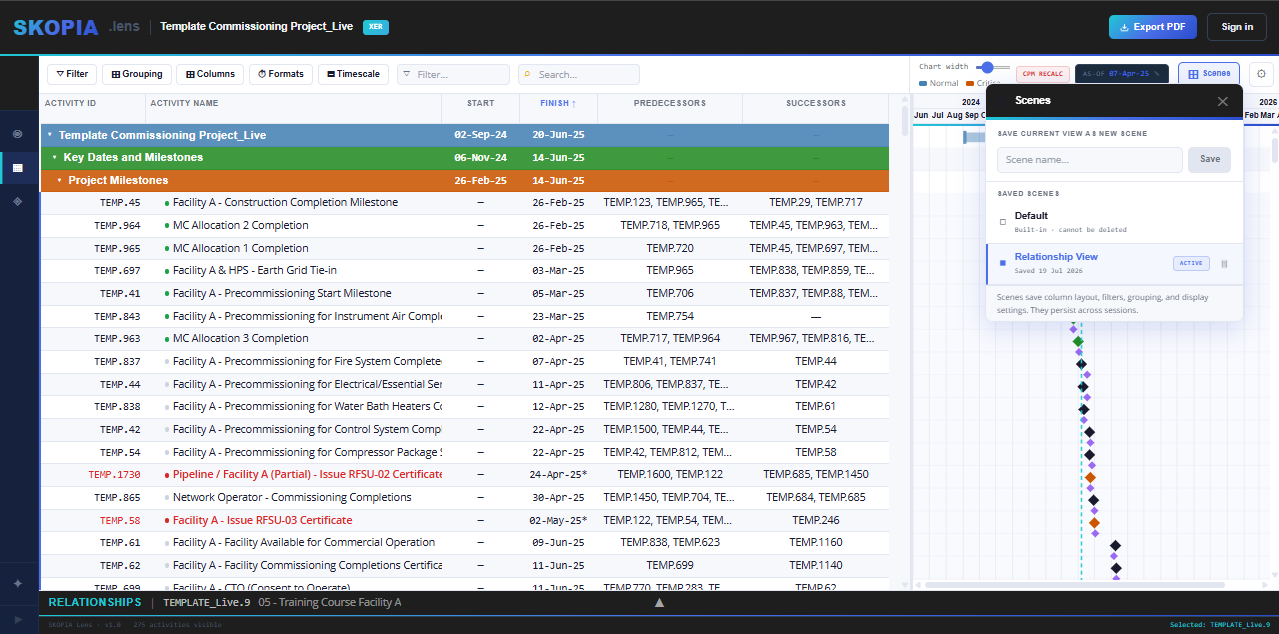
Found a view structure you like — a grouping, a WBS filter, a column set, all combined? Save it as a Scene. Same idea as Views/Layouts in P6: switch between saved setups in one click instead of rebuilding them each time.
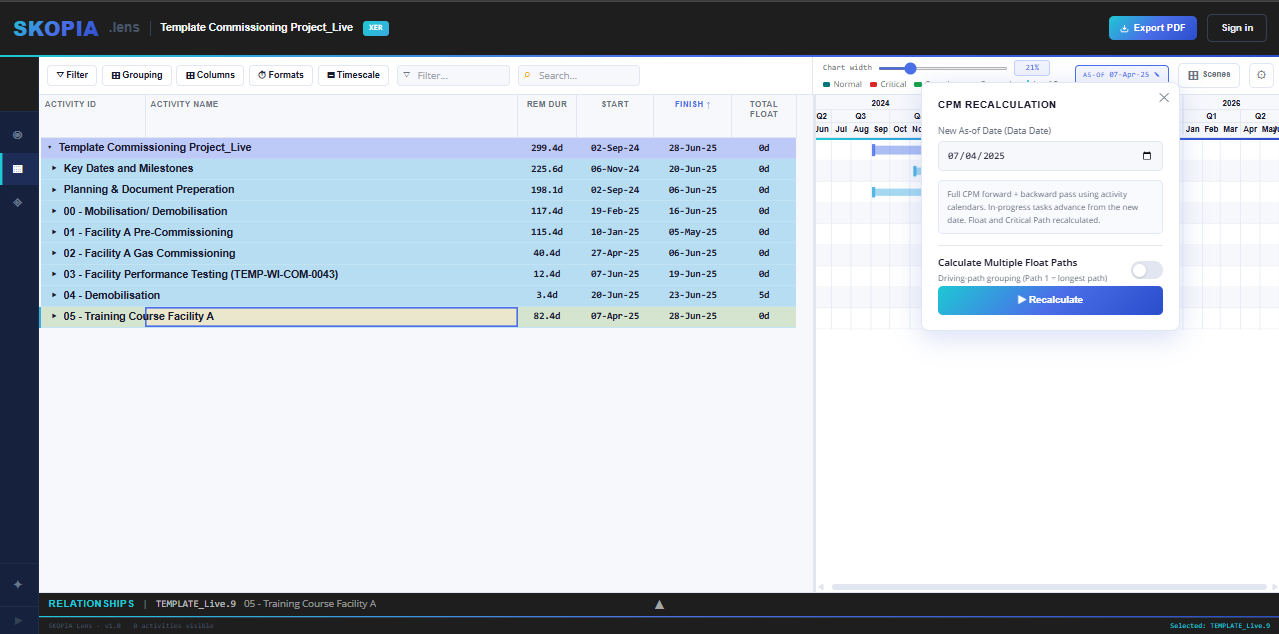
PRO This is the one worth spending real time on, on Lens Pro and above. Click As-of Date and you're into the CPM engine — move the status/data date and SKOPIA recalculates forward and backward pass live, or run Calculate Multiple Float Paths the way you would in P6.
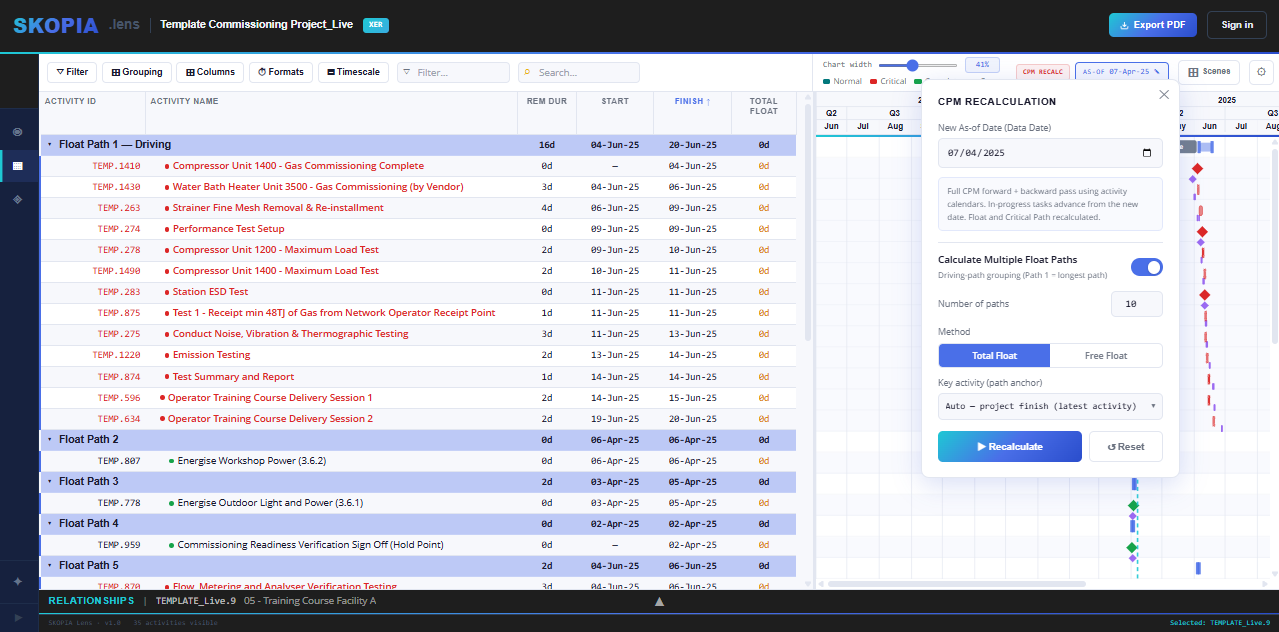
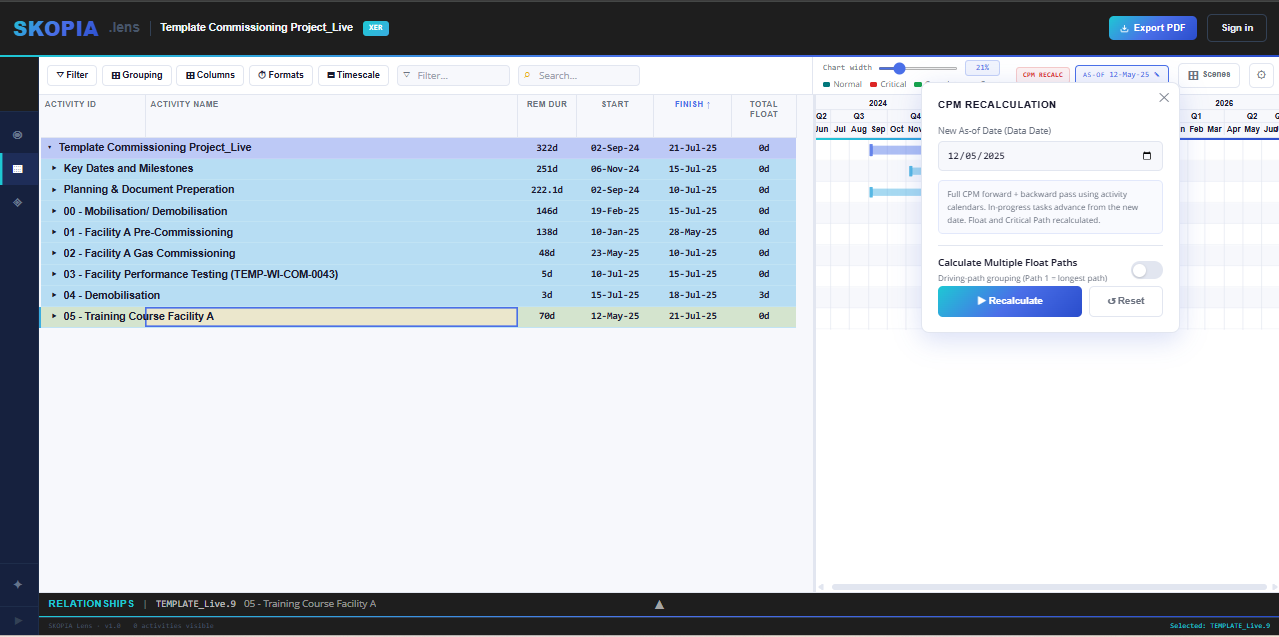
Once float paths have been calculated, group by Float Path from the Grouping dropdown (section 03) to see the schedule laid out path-by-path, same as a DCMA #12/float path review in P6.
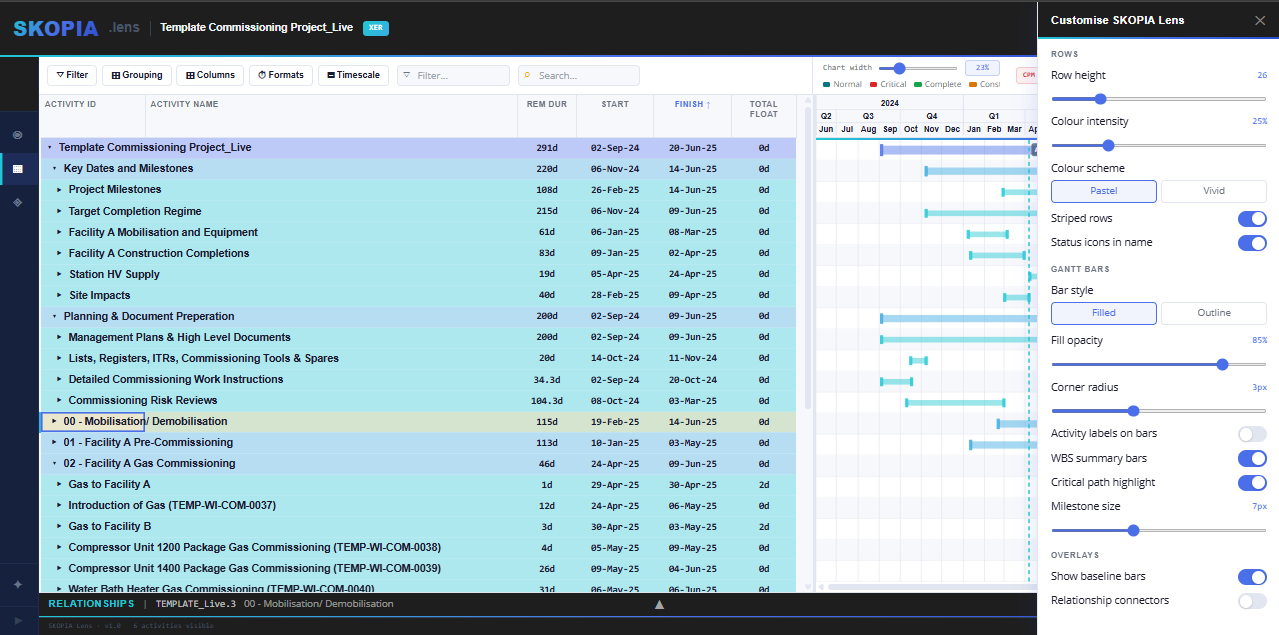
Click the settings icon in the top-right of the toolbar to open Customise SKOPIA Lens — a live styling panel for the table and the Gantt. It opens with four collapsed sections; click one to expand it, and ✕ to close the panel.
- General — row height, striped rows, status icons in name, Gantt chart tooltips.
- Schedule Table — Pastel or Vivid, colour intensity, and band styles per grouping level (colour, text colour, bold / italic, size).
- Gantt Chart — bar style, opacity, corner radius, activity labels (pick a column for Left, Inside, Right), WBS summary bars, critical highlight, milestone size, bar height, Total Float bar, near-critical colour with a TF threshold, baseline bars and relationship connectors. Bar & link colours sets your own colour for every bar and link type.
- Update Rules — view the project's progress settings and how they rate.
Every colour swatch opens one picker with Hex, RGB, presets and My colours for your company palette.
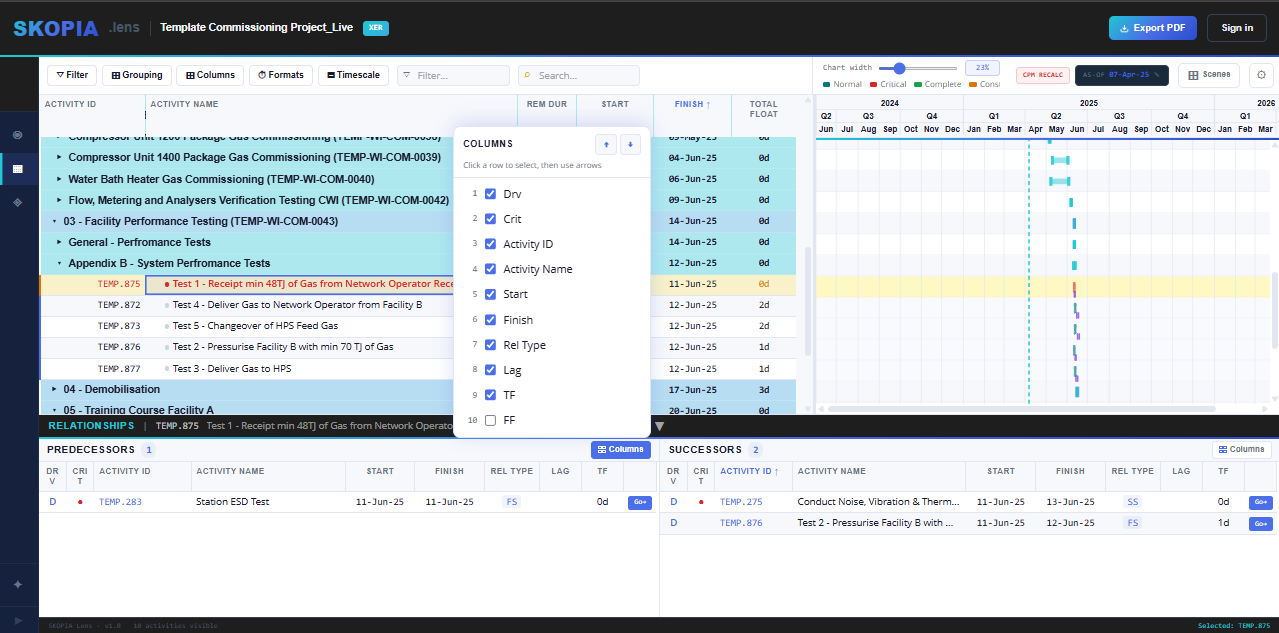
Click any activity and the Relationships panel opens along the bottom, split into Predecessors and Successors. Every logic tie for that activity is listed with its relationship type, lag, and total float — everything you need to trace logic without leaving the row you're on.
- Columns — click the Columns button on either panel to add, remove, or reorder what's shown (Driving, Critical, Activity ID, Activity Name, Start, Finish, Rel Type, Lag, Total Float, Free Float, and more). Click a row in the picker, then use the arrows to move it.
- Sort — click any column header in the Predecessors or Successors table to sort by that column.
- Go — click Go next to any predecessor or successor to jump straight to that activity, with its own relationships loading underneath. Trace a logic chain link by link without losing your place.
Two tabs sit to the left of Relationships on every plan: General (type, duration type, % complete type, calendar) and Status (durations, actual dates, % complete, constraints, units). They're read-only except on SKOPIA Command. Click the panel's header bar to collapse or open it. Command adds Resource Assignments and Resource Histogram — see the Resources guide.